Market Commentary by Scott J. Brown, Ph.D., Chief Economist
 The economic data reports were expected to be a series of tough hurdles for the stock market, but they ended up more like minor speed bumps. Share prices continued to rally broadly. The bond market was volatile, as investors debated when the Fed may begin to taper its asset purchases.
Retail sales results for April were better than anticipated – not strong, but not as bad as feared. Industrial production was weaker than expected. Residential construction figures were mixed, reflecting a high degree of volatility in the multi-family sector and continued strength in single-family homebuilding.
The Fed’s two major regional factory sector surveys were weak. The Consumer Price Index fell more than anticipated in April (up 1.1% y/y), with low core inflation (+1.7% y/y). Consumer sentiment improved in the mid-May assessment. The Index of Leading Economic Indicators rose 0.6%, reflecting a jump in building permits.The Congressional Budget Office lowered its estimate of the FY13 budget deficit by about $200 billion (relative to its previous forecast made three months ago) – about half of that improvement was due to payments made from Fannie Mae and Freddie Mac (which are not expected to continue), but the longer-term budget outlook also improved.
Next week, the economic calendar thins out somewhat. The reports on new home sales and durable goods orders tend to be volatile (choppy and subject to large revisions), and could surprise. However, the focus is expected to be on Bernanke’s JEC testimony (the topic is “the economic outlook”). The Fed Chairman will present a general assessment of the economy and may provide some clues on what would trigger a slowing in the rate of asset purchases.
Indices
| Last | Last Week | YTD return % | |
| DJIA | 15233.22 | 15082.62 | 16.25% |
| NASDAQ | 3465.24 | 3409.17 | 14.76% |
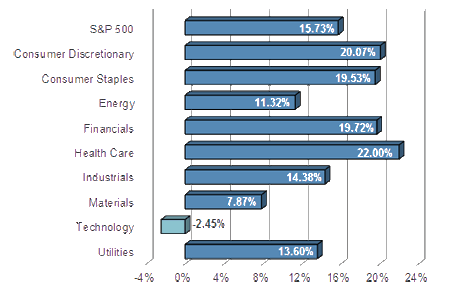
| S&P 500 | 1650.47 | 1626.67 | 15.73% |
| MSCI EAFE | 1772.81 | 1767.32 | 10.52% |
| Russell 2000 | 985.34 | 966.26 | 16.01% |
Consumer Money Rates
| Last | 1-year ago | |
| Prime Rate | 3.25 | 3.25 |
| Fed Funds | 0.12 | 0.17 |
| 30-year mortgage | 3.42 | 3.79 |
Currencies
| Last | 1-year ago | |
| Dollars per British Pound | 1.530 | 1.594 |
| Dollars per Euro | 1.290 | 1.274 |
| Japanese Yen per Dollar | 102.130 | 80.260 |
| Canadian Dollars per Dollar | 1.017 | 1.010 |
| Mexican Peso per Dollar | 12.253 | 13.789 |
Commodities
| Last | 1-year ago | |
| Crude Oil | 95.16 | 92.81 |
| Gold | 1385.86 | 1542.55 |
Bond Rates
| Last | 1-month ago | |
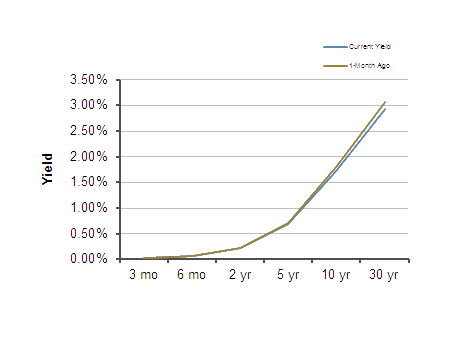
| 2-year treasury | 0.23 | 0.23 |
| 10-year treasury | 1.93 | 1.70 |
| 10-year municipal (TEY) | 3.08 | 3.02 |
Treasury Yield Curve – 05/17/2013
S&P Sector Performance (YTD) – 05/17/2013
Economic Calendar
| May 22nd |
— |
Existing Home Sales (April) Bernanke JEC Testimony FOMC Minutes (May 1st) |
| May 23rd |
— |
Jobless Claims (week ending May 18th) New Home Sales (April) |
| May 24th |
— |
Durable Goods Orders (April) |
| May 27th |
— |
Memorial Day Holiday – markets closed |
| May 28th |
— |
Consumer Confidence (May) |
| May 30th |
— |
Real GDP (1Q13, 2nd estimate) |
| June 7th |
— |
Employment Report (May) |
| June 19th |
— |
FOMC Policy Decision, Bernanke Press Briefing |
Important Disclosures
US government bonds and treasury bills are guaranteed by the US government and, if held to maturity, offer a fixed rate of return and guaranteed principal value. US government bonds are issued and guaranteed as to the timely payment of principal and interest by the federal government. Treasury bills are certificates reflecting short-term (less than one year) obligations of the US government.
Commodities trading is generally considered speculative because of the significant potential for investment loss. Markets for commodities are likely to be volatile and there may be sharp price fluctuations even during periods when prices overall are rising. Specific sector investing can be subject to different and greater risks than more diversified investments.
Tax Equiv Muni yields (TEY) assume a 35% tax rate on triple-A rated, tax-exempt insured revenue bonds.
![]() Material prepared by Raymond James for use by its financial advisors.
Material prepared by Raymond James for use by its financial advisors.
The information contained herein has been obtained from sources considered reliable, but we do not guarantee that the foregoing material is accurate or complete. Data source: Bloomberg, as of close of business May 16th, 2013.
©2013 Raymond James Financial Services, Inc. member FINRA / SIPC.


