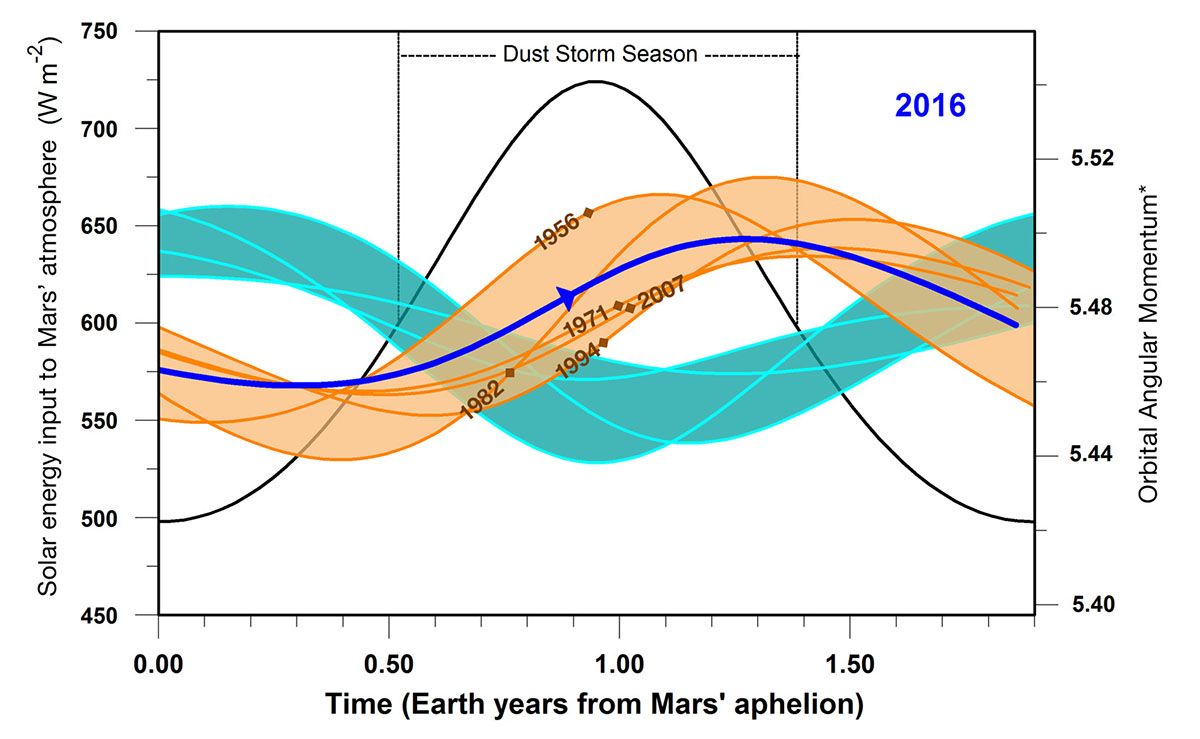
This graphic indicates a similarity between 2016 (dark blue line) and five past years in which Mars has experienced global dust storms (orange lines and band), compared to years with no global dust storm (blue-green lines and band). The horizontal scale is time-of-year on Mars. (NASA/JPL-Caltech)
Home This graphic indicates a similarity between 2016 (dark blue line) and five past years in which Mars has experienced global dust storms (orange lines and band), compared to years with no global dust storm (blue-green lines and band). The horizontal scale is time-of-year on Mars. (NASA/JPL-Caltech) This graphic indicates a similarity between 2016 (dark blue line) and five past years in which Mars has experienced global dust storms (orange lines and band), compared to years with no global dust storm (blue-green lines and band). The horizontal scale is time-of-year on Mars. (NASA/JPL-Caltech)
This graphic indicates a similarity between 2016 (dark blue line) and five past years in which Mars has experienced global dust storms (orange lines and band), compared to years with no global dust storm (blue-green lines and band). The horizontal scale is time-of-year on Mars. (NASA/JPL-Caltech)