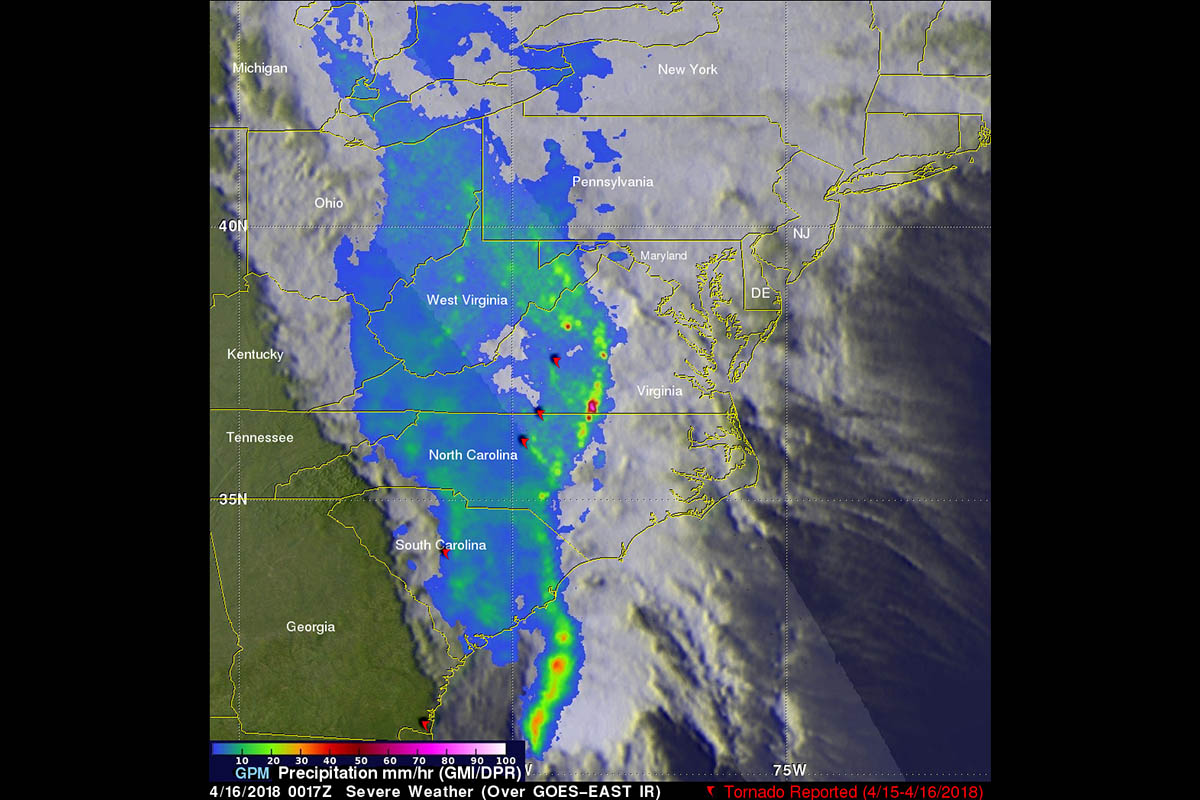
GPM captured an image of the advancing line of storms on April 16 at 00:17 UTC (8:17 pm EDT, April 15). GPM showed a narrow leading line of thunderstorms producing heavy rain rates (orange and red areas), followed by a much broader area of light to moderate rain (blue and lighter green areas). (NASA/JAXA, Hal Pierce)
Home GPM captured an image of the advancing line of storms on April 16 at 00:17 UTC (8:17 pm EDT, April 15). GPM showed a narrow leading line of thunderstorms producing heavy rain rates (orange and red areas), followed by a much broader area of light to moderate rain (blue and lighter green areas). (NASA/JAXA, Hal Pierce) GPM captured an image of the advancing line of storms on April 16 at 00:17 UTC (8:17 pm EDT, April 15). GPM showed a narrow leading line of thunderstorms producing heavy rain rates (orange and red areas), followed by a much broader area of light to moderate rain (blue and lighter green areas). (NASA/JAXA, Hal Pierce)
GPM captured an image of the advancing line of storms on April 16 at 00:17 UTC (8:17 pm EDT, April 15). GPM showed a narrow leading line of thunderstorms producing heavy rain rates (orange and red areas), followed by a much broader area of light to moderate rain (blue and lighter green areas). (NASA/JAXA, Hal Pierce)