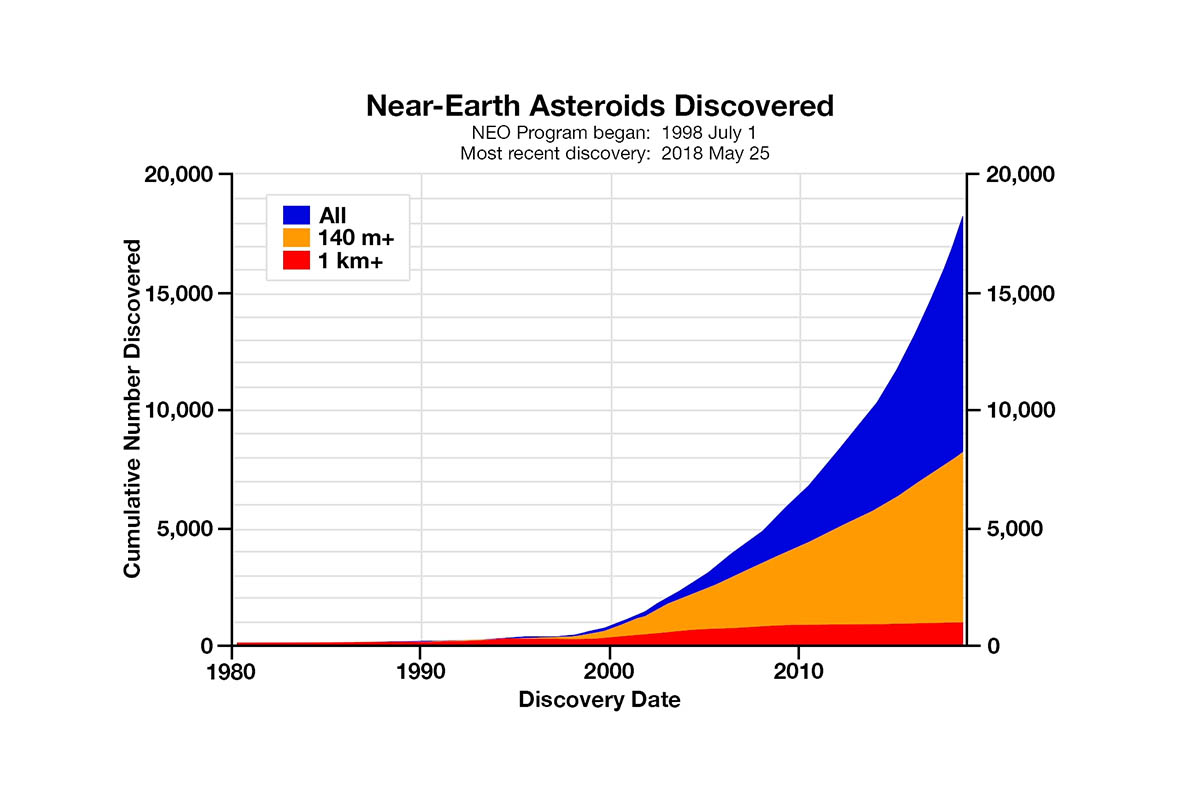
The chart depicts the cumulative number of known Near-Earth asteroids (NEAs) versus time. The area in red depicts the number of known NEAs larger than 0.6 miles (1 kilometer). The area in orange depicts the quantity of known NEAs larger than 460 feet (140 meters). The area in blue depicts the number of known NEAs in all sizes. (NASA/JPL-Caltech)
Home The chart depicts the cumulative number of known Near-Earth asteroids (NEAs) versus time. The area in red depicts the number of known NEAs larger than 0.6 miles (1 kilometer). The area in orange depicts the quantity of known NEAs larger than 460 feet (140 meters). The area in blue depicts the number of known NEAs in all sizes. (NASA/JPL-Caltech) The chart depicts the cumulative number of known Near-Earth asteroids (NEAs) versus time. The area in red depicts the number of known NEAs larger than 0.6 miles (1 kilometer). The area in orange depicts the quantity of known NEAs larger than 460 feet (140 meters). The area in blue depicts the number of known NEAs in all sizes. (NASA/JPL-Caltech)
The chart depicts the cumulative number of known Near-Earth asteroids (NEAs) versus time. The area in red depicts the number of known NEAs larger than 0.6 miles (1 kilometer). The area in orange depicts the quantity of known NEAs larger than 460 feet (140 meters). The area in blue depicts the number of known NEAs in all sizes. (NASA/JPL-Caltech)