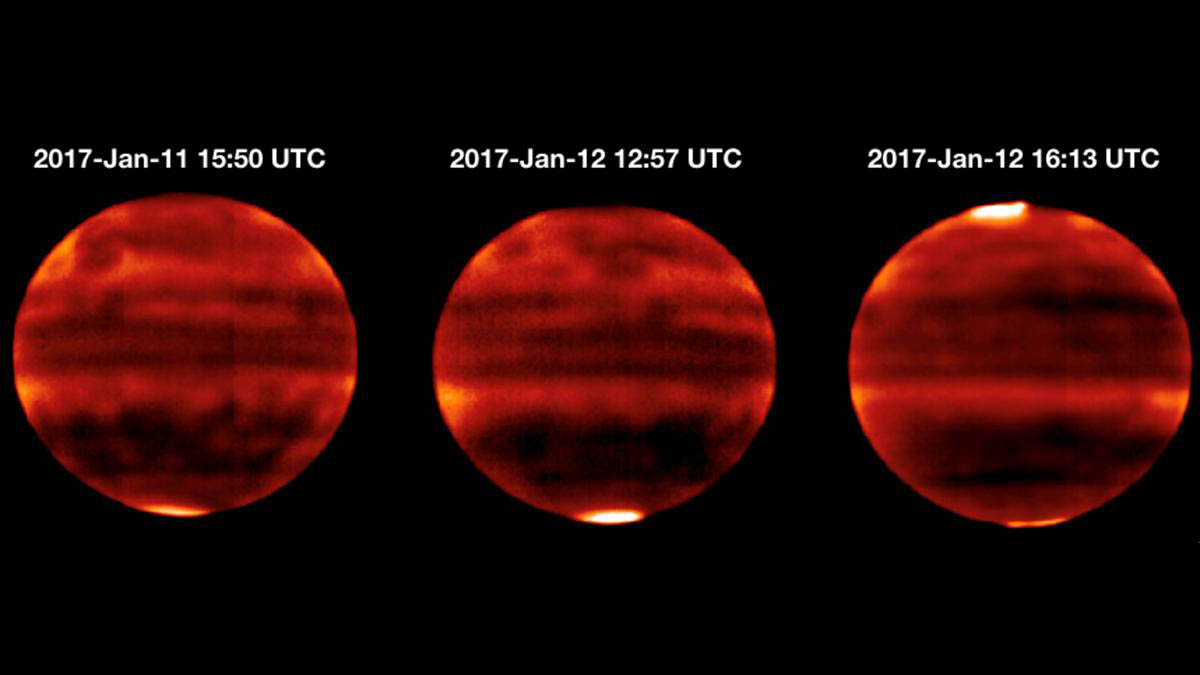
Sensitive to Jupiter’s stratospheric temperatures, these infrared images were recorded by the Cooled Mid-Infrared Camera and Spectrograph (COMICS) at the Subaru Telescope on the summit of Mauna Kea, Hawaii. Areas that are more yellow and red indicate the hotter regions. (NAOJ and NASA/JPL-Caltech)
Home Sensitive to Jupiter’s stratospheric temperatures, these infrared images were recorded by the Cooled Mid-Infrared Camera and Spectrograph (COMICS) at the Subaru Telescope on the summit of Mauna Kea, Hawaii. Areas that are more yellow and red indicate the hotter regions. (NAOJ and NASA/JPL-Caltech) Sensitive to Jupiter's stratospheric temperatures, these infrared images were recorded by the Cooled Mid-Infrared Camera and Spectrograph (COMICS) at the Subaru Telescope on the summit of Mauna Kea, Hawaii. Areas that are more yellow and red indicate the hotter regions. (NAOJ and NASA/JPL-Caltech)
Sensitive to Jupiter’s stratospheric temperatures, these infrared images were recorded by the Cooled Mid-Infrared Camera and Spectrograph (COMICS) at the Subaru Telescope on the summit of Mauna Kea, Hawaii. Areas that are more yellow and red indicate the hotter regions. (NAOJ and NASA/JPL-Caltech)