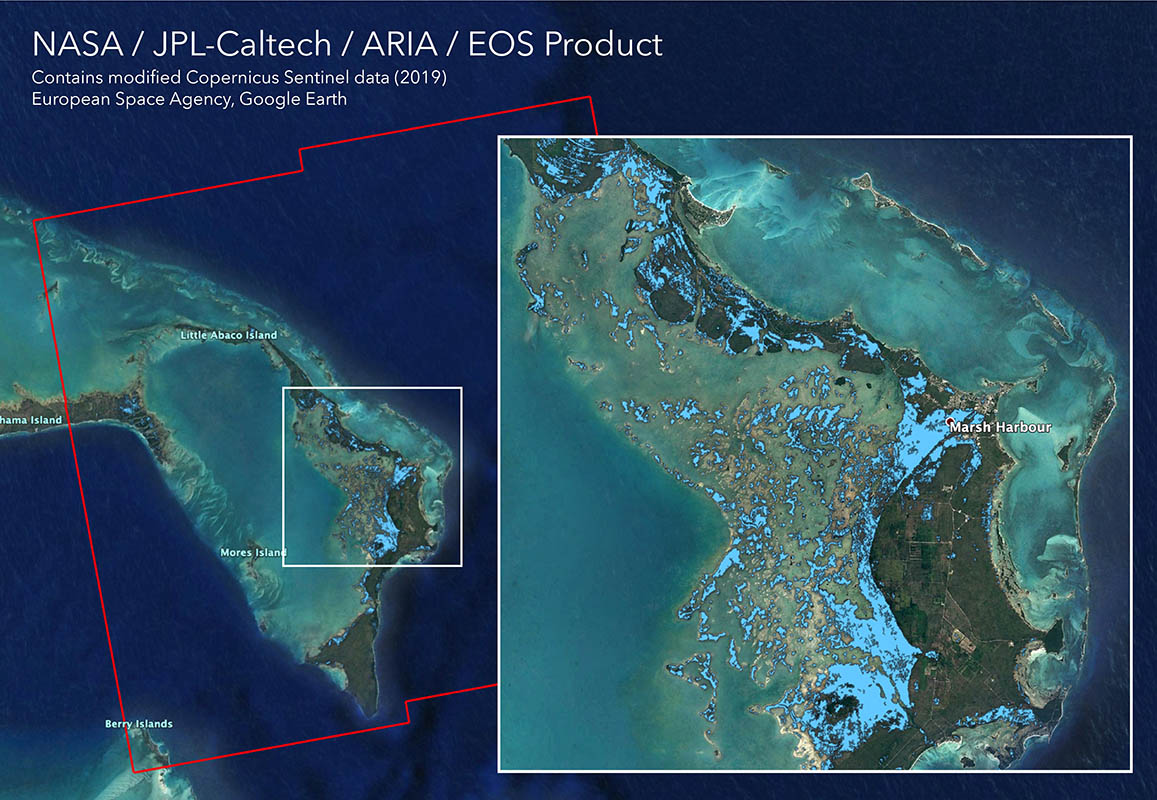
The Advanced Rapid Imaging and Analysis (ARIA) team at NASA’s Jet Propulsion Laboratory in Pasadena, California, created this flood map depicting areas of the Bahamas that are likely flooded (shown by light blue pixels) as a result of Hurricane Dorian. (NASA)
Home The Advanced Rapid Imaging and Analysis (ARIA) team at NASA’s Jet Propulsion Laboratory in Pasadena, California, created this flood map depicting areas of the Bahamas that are likely flooded (shown by light blue pixels) as a result of Hurricane Dorian. (NASA) The Advanced Rapid Imaging and Analysis (ARIA) team at NASA's Jet Propulsion Laboratory in Pasadena, California, created this flood map depicting areas of the Bahamas that are likely flooded (shown by light blue pixels) as a result of Hurricane Dorian. (NASA)
The Advanced Rapid Imaging and Analysis (ARIA) team at NASA’s Jet Propulsion Laboratory in Pasadena, California, created this flood map depicting areas of the Bahamas that are likely flooded (shown by light blue pixels) as a result of Hurricane Dorian. (NASA)