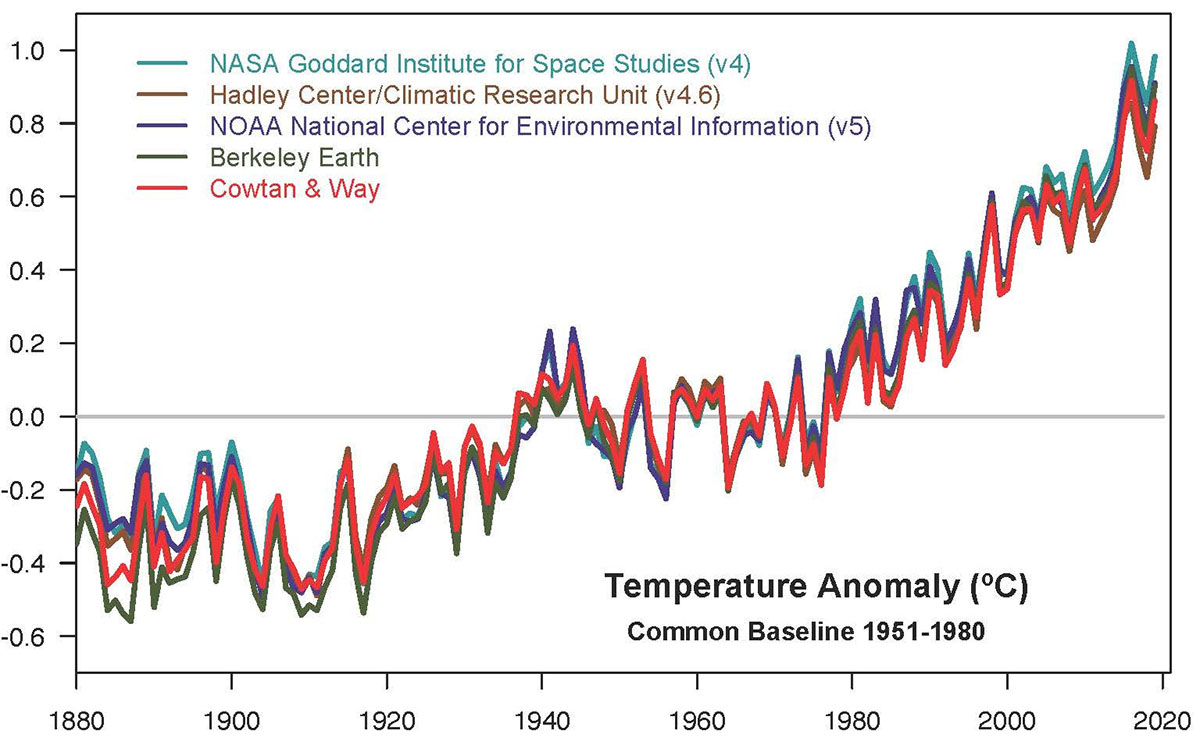
This plot shows yearly temperature anomalies from 1880 to 2019, with respect to the 1951-1980 mean, as recorded by NASA, NOAA, the Berkeley Earth research group, the Met Office Hadley Centre (UK), and the Cowtan and Way analysis. Though there are minor variations from year to year, all five temperature records show peaks and valleys in sync with each other. (NASA GISS/Gavin Schmidt)
Home This plot shows yearly temperature anomalies from 1880 to 2019, with respect to the 1951-1980 mean, as recorded by NASA, NOAA, the Berkeley Earth research group, the Met Office Hadley Centre (UK), and the Cowtan and Way analysis. Though there are minor variations from year to year, all five temperature records show peaks and valleys in sync with each other. (NASA GISS/Gavin Schmidt) This plot shows yearly temperature anomalies from 1880 to 2019, with respect to the 1951-1980 mean, as recorded by NASA, NOAA, the Berkeley Earth research group, the Met Office Hadley Centre (UK), and the Cowtan and Way analysis. Though there are minor variations from year to year, all five temperature records show peaks and valleys in sync with each other. (NASA GISS/Gavin Schmidt)
This plot shows yearly temperature anomalies from 1880 to 2019, with respect to the 1951-1980 mean, as recorded by NASA, NOAA, the Berkeley Earth research group, the Met Office Hadley Centre (UK), and the Cowtan and Way analysis. Though there are minor variations from year to year, all five temperature records show peaks and valleys in sync with each other. (NASA GISS/Gavin Schmidt)


