 Washington, D.C. – Over the past weeks, Americans’ efforts to slow COVID-19 Coronavirus’s spread have helped flatten the curve. As a result of this action, the Bureau of Labor Statistics’ (BLS) April Employment Situation report shows that nonfarm payroll employment fell by 20.5 million and the unemployment rate (U-3) jumped 10.3 percentage points to 14.7 percent.
Both of these monthly changes are the largest in the series’ histories, as never before has the United States halted large portions of its economic activity.
While April’s jobs numbers may astound Americans, the economy’s strength earlier this year put the Nation in a better position to make temporary economic sacrifices to slow COVID-19 Coronavirus’s spread. After all, the unemployment rate stood at a 50-year low of 3.5 percent only two months ago.
Aided by Federal policy, the connection between many unemployed individuals and their previous employers remains strong—as temporary layoffs account for many of April’s job losses and all of the month’s unemployment increase. But these connections deteriorate the longer that States continue limiting economic activity. As States start or consider reopening their economies in a responsible way, it is critical that policymakers’ focus expands to reviving the health of the United States labor force.
The April report also shows that the African American unemployment rate rose 10.0 percentage points to 16.7 percent, and that the Hispanic American unemployment rate rose 12.9 percentage points to 18.9 percent. These substantial increases come after unemployment rates for both demographics reached historic lows in 2019.
Furthermore, those with lower education levels are experiencing the largest job losses. The unemployment rate for those without a high school diploma rose 14.4 percentage points to 21.2 percent in April, and the unemployment rate for those with only a high school degree rose 12.9 percentage points to 17.3 percent.
Even though April’s unemployment rate reached the highest level on record, COVID-19’s sudden shock to the labor market has put more people out of work than the top-line number suggests. Those who lost their jobs and are not looking for work do not count as unemployed unless they are temporarily laid off; instead, they count as not in the labor force.
Since the U-3 rate is calculated by dividing the number of the unemployed by the size of the labor force, the prevalence of this category of workers substantially changes the unemployment rate calculation. Flows from employment to not in the labor force totaled 9.5 million from March to April, compared with 17.5 million people who moved from employment to unemployment. Adding the increase in the number of Americans who were classified as not in the labor force because they are not searching for work further increases April’s unemployment rate.
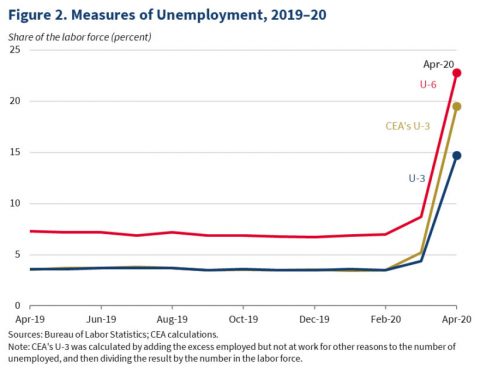
Additionally, the number of temporarily laid off workers is likely higher than BLS reports. Compared to the average April value over the previous four years, 7.5 million more workers were classified as employed but not at work for “other reasons” last month. Reclassifying these workers, who may be on temporary layoff and not getting paid, as unemployed would raise April’s U-3 rate to 19.5 percent. Figure 1 shows the distribution of types of job loss in April, including the excess workers who claim to be employed but not at work for “other reasons.”
BLS has other unemployment metrics to help capture this unprecedented labor market situation. While not the same as CEA’s modified U-3 rate of 19.5 percent shown in Figure 2, the more comprehensive U-6 rate captures workers who are part-time for economic reasons, as well as discouraged or marginally attached workers who were unemployed prior to the crisis and stopped searching for work. After hitting a series low of 6.7 percent in December 2019, the U-6 rate increased to 22.8 percent in April.

The April jobs report shows that the key to the labor market’s rebound—bonds between employers and employees—remains even while many Americans are not working. Looking ahead to next month, with many States reopening their economies, the May report may show early signs of the economic comeback. However, given the 7 million initial unemployment insurance claims filed since the April report’s reference period, and that the May report’s household survey covers next week, further indications of recovery may not be shown until the June report—even if they are already underway.
Workers’ economic sacrifices allowed the United States to keep healthcare capacity from being exceeded in most of the Nation. But temporarily shutting down large portions of the economy to ensure adequate healthcare capacity and create systems to protect the most vulnerable came at a high cost—especially for minority and lower-income workers.
While Federal responses have enabled more workers to remain attached to their jobs for now, these critical attachments will weaken the longer that State-imposed shutdowns are in effect. As April’s jobs report shows, the declining health of America’s labor force needs to be considered as the Nation continues responding to COVID-19 Coronavirus.


