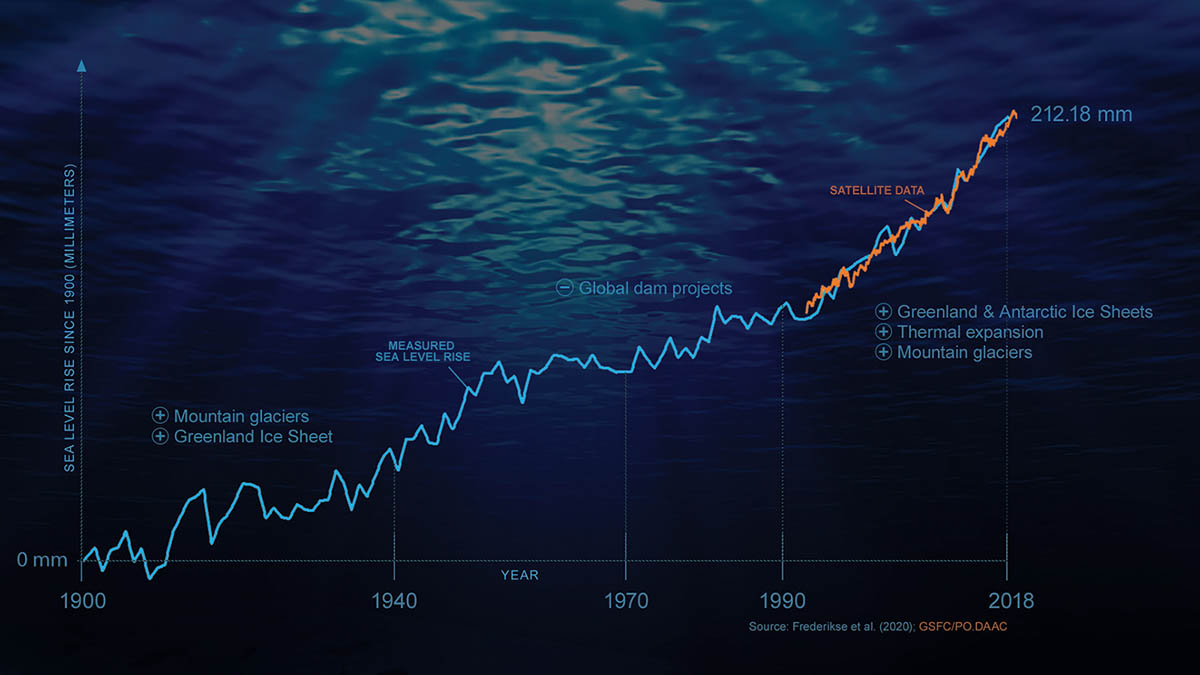
This infographic shows the rise in sea levels since 1900. Pre-1940, glaciers and Greenland meltwater dominated the rise; dam projects slowed the rise in the 1970s. Now, ice sheet and glacier melt, plus thermal expansion, dominate the rise. Tide-gauge data shown in blue and satellite data in orange. (NASA/JPL-Caltech)
Home This infographic shows the rise in sea levels since 1900. Pre-1940, glaciers and Greenland meltwater dominated the rise; dam projects slowed the rise in the 1970s. Now, ice sheet and glacier melt, plus thermal expansion, dominate the rise. Tide-gauge data shown in blue and satellite data in orange. (NASA/JPL-Caltech) This infographic shows the rise in sea levels since 1900. Pre-1940, glaciers and Greenland meltwater dominated the rise; dam projects slowed the rise in the 1970s. Now, ice sheet and glacier melt, plus thermal expansion, dominate the rise. Tide-gauge data shown in blue and satellite data in orange. (NASA/JPL-Caltech)
This infographic shows the rise in sea levels since 1900. Pre-1940, glaciers and Greenland meltwater dominated the rise; dam projects slowed the rise in the 1970s. Now, ice sheet and glacier melt, plus thermal expansion, dominate the rise. Tide-gauge data shown in blue and satellite data in orange. (NASA/JPL-Caltech)