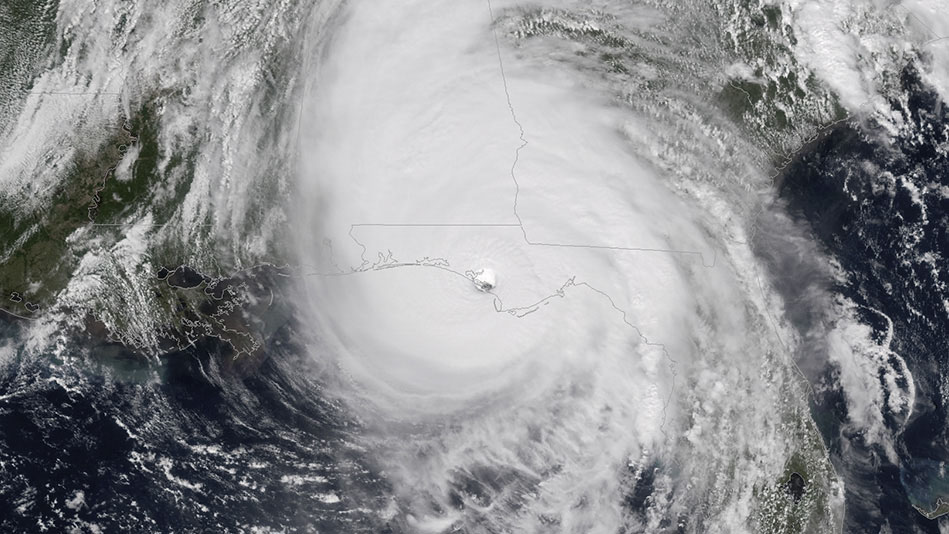
NOAA’s GOES-East satellite captured this image of Hurricane Michael as it came ashore near Mexico Beach, Florida, on Oct. 10, 2018. (NOAA)
Home NOAA’s GOES-East satellite captured this image of Hurricane Michael as it came ashore near Mexico Beach, Florida, on Oct. 10, 2018. (NOAA) NOAA's GOES-East satellite captured this image of Hurricane Michael as it came ashore near Mexico Beach, Florida, on Oct. 10, 2018. (NOAA)
NOAA’s GOES-East satellite captured this image of Hurricane Michael as it came ashore near Mexico Beach, Florida, on Oct. 10, 2018. (NOAA)