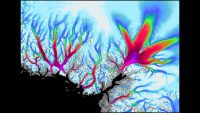
Greenland appears in this image created using data from the ITS_LIVE project, hosted at NASA’s Jet Propulsion Laboratory. The coloring around the coast of the arctic island shows the speed of outlet glaciers flowing into the ocean. (NASA/JPL-Caltech/USGS)
Home Greenland appears in this image created using data from the ITS_LIVE project, hosted at NASA’s Jet Propulsion Laboratory. The coloring around the coast of the arctic island shows the speed of outlet glaciers flowing into the ocean. (NASA/JPL-Caltech/USGS) Greenland appears in this image created using data from the ITS_LIVE project, hosted at NASA's Jet Propulsion Laboratory. The coloring around the coast of the arctic island shows the speed of outlet glaciers flowing into the ocean. (NASA/JPL-Caltech/USGS)
Greenland appears in this image created using data from the ITS_LIVE project, hosted at NASA’s Jet Propulsion Laboratory. The coloring around the coast of the arctic island shows the speed of outlet glaciers flowing into the ocean. (NASA/JPL-Caltech/USGS)