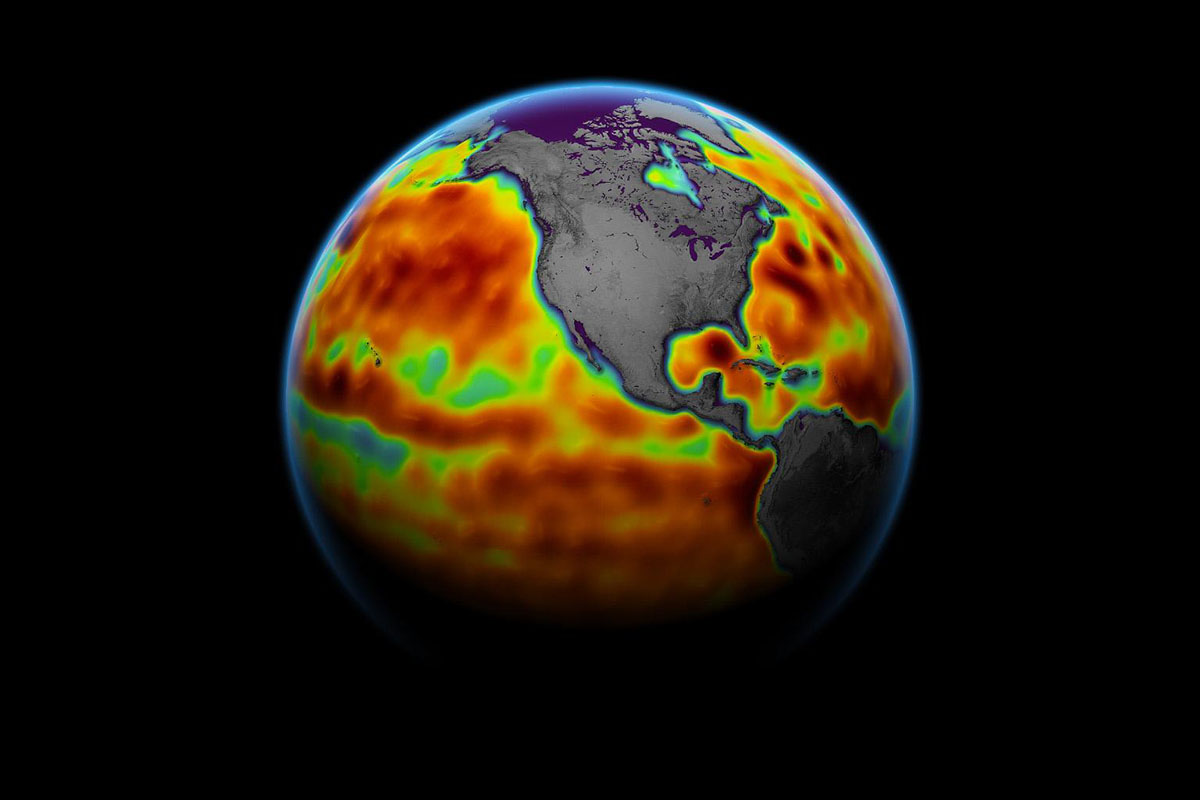
This map shows sea level measured by the Sentinel-6 Michael Freilich satellite from June 5th to 15th. Red areas are regions where sea level is higher than normal, and blue areas indicate areas where it’s lower than normal. (NASA Earth Observatory)
Home This map shows sea level measured by the Sentinel-6 Michael Freilich satellite from June 5th to 15th. Red areas are regions where sea level is higher than normal, and blue areas indicate areas where it’s lower than normal. (NASA Earth Observatory) This map shows sea level measured by the Sentinel-6 Michael Freilich satellite from June 5th to 15th. Red areas are regions where sea level is higher than normal, and blue areas indicate areas where it's lower than normal. (NASA Earth Observatory)
This map shows sea level measured by the Sentinel-6 Michael Freilich satellite from June 5th to 15th. Red areas are regions where sea level is higher than normal, and blue areas indicate areas where it’s lower than normal. (NASA Earth Observatory)