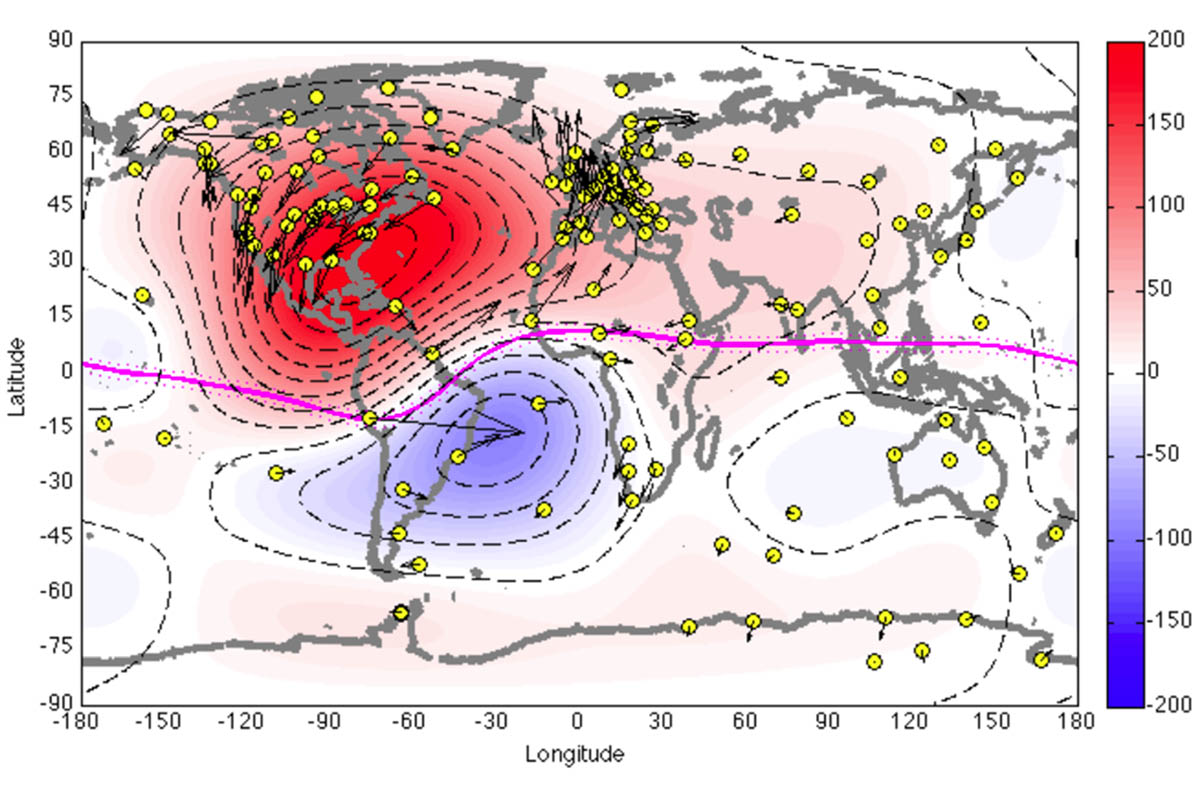
A map of the ionospheric currents at the time of Dynamo 1’s launch on July 4, 2013. Currents – whose intensity is marked by red and blue coloring – travel in opposite directions on either side of the magnetic equator, marked with a pink line. The yellow dots are magnetometer readings from the ground. (NASA/JAXA/R. Pfaff et al)
Home A map of the ionospheric currents at the time of Dynamo 1’s launch on July 4, 2013. Currents – whose intensity is marked by red and blue coloring – travel in opposite directions on either side of the magnetic equator, marked with a pink line. The yellow dots are magnetometer readings from the ground. (NASA/JAXA/R. Pfaff et al) A map of the ionospheric currents at the time of Dynamo 1’s launch on July 4, 2013. Currents – whose intensity is marked by red and blue coloring – travel in opposite directions on either side of the magnetic equator, marked with a pink line. The yellow dots are magnetometer readings from the ground. (NASA/JAXA/R. Pfaff et al)
A map of the ionospheric currents at the time of Dynamo 1’s launch on July 4, 2013. Currents – whose intensity is marked by red and blue coloring – travel in opposite directions on either side of the magnetic equator, marked with a pink line. The yellow dots are magnetometer readings from the ground. (NASA/JAXA/R. Pfaff et al)