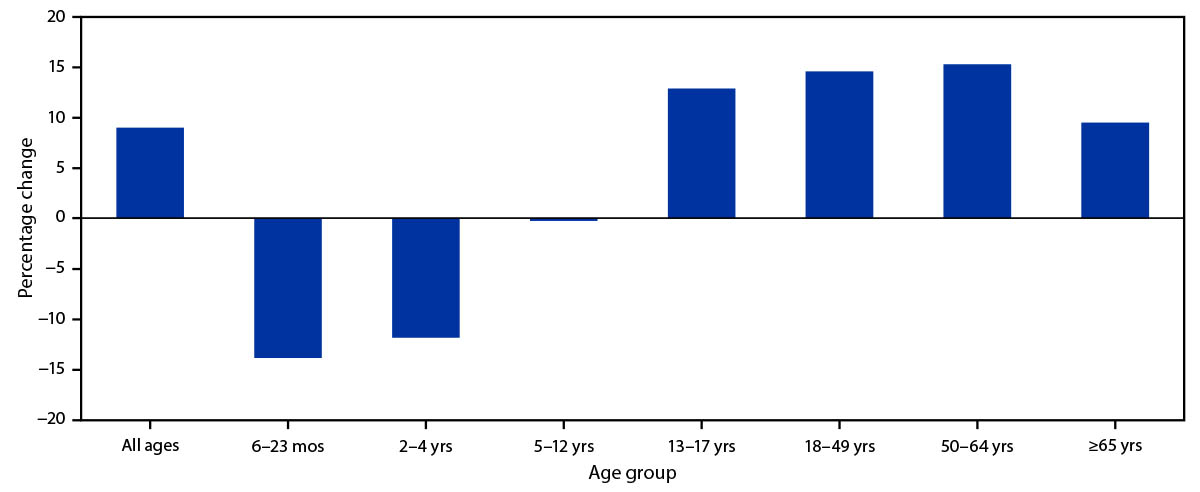
FIGURE 2. Percentage change in the number of administered influenza vaccine doses reported to immunization information systems† in persons aged ?6 months during 2020 compared with the average number of doses administered during the same period in 2018 and 2019 — 11 U.S. jurisdictions, September–December 2020
Home FIGURE 2. Percentage change in the number of administered influenza vaccine doses reported to immunization information systems† in persons aged ?6 months during 2020 compared with the average number of doses administered during the same period in 2018 and 2019 — 11 U.S. jurisdictions, September–December 2020 FIGURE 2. Percentage change in the number of administered influenza vaccine doses reported to immunization information systems† in persons aged ?6 months during 2020 compared with the average number of doses administered during the same period in 2018 and 2019 — 11 U.S. jurisdictions, September–December 2020
FIGURE 2. Percentage change in the number of administered influenza vaccine doses reported to immunization information systems† in persons aged ?6 months during 2020 compared with the average number of doses administered during the same period in 2018 and 2019 — 11 U.S. jurisdictions, September–December 2020