41.9 F
Clarksville
Friday, March 29, 2024
Home A picture of the rocket plumes shortly after the launch of both Dynamo rockets from Wallops Flight Facility on July 4, 2013. (NASA/JAXA/R. Pfaff et al/Ken Kramer) A picture of the rocket plumes shortly after the launch of both Dynamo rockets from Wallops Flight Facility on July 4, 2013. (NASA/JAXA/R. Pfaff et al/Ken Kramer)

A picture of the rocket plumes shortly after the launch of both Dynamo rockets from Wallops Flight Facility on July 4, 2013. (NASA/JAXA/R. Pfaff et al/Ken Kramer)
A picture of the rocket plumes shortly after the launch of both Dynamo rockets from Wallops Flight Facility on July 4, 2013. (NASA/JAXA/R. Pfaff et al/Ken Kramer)

A picture of the rocket plumes shortly after the launch of both Dynamo rockets from Wallops Flight Facility on July 4, 2013. (NASA/JAXA/R. Pfaff et al/Ken Kramer)

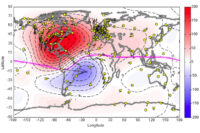
A map of the ionospheric currents at the time of Dynamo 1’s launch on July 4, 2013. Currents – whose intensity is marked by red and blue coloring – travel in opposite directions on either side of the magnetic equator, marked with a pink line. The yellow dots are magnetometer readings from the ground. (NASA/JAXA/R. Pfaff et al)
Illustration of NASA’s Ionospheric Connection Explorer, or ICON. ICON explores Earth’s upper atmosphere and ionosphere, a region influenced by both terrestrial weather and changes in near-Earth space. (NASA’s Goddard Space Flight Center Conceptual Image Lab)