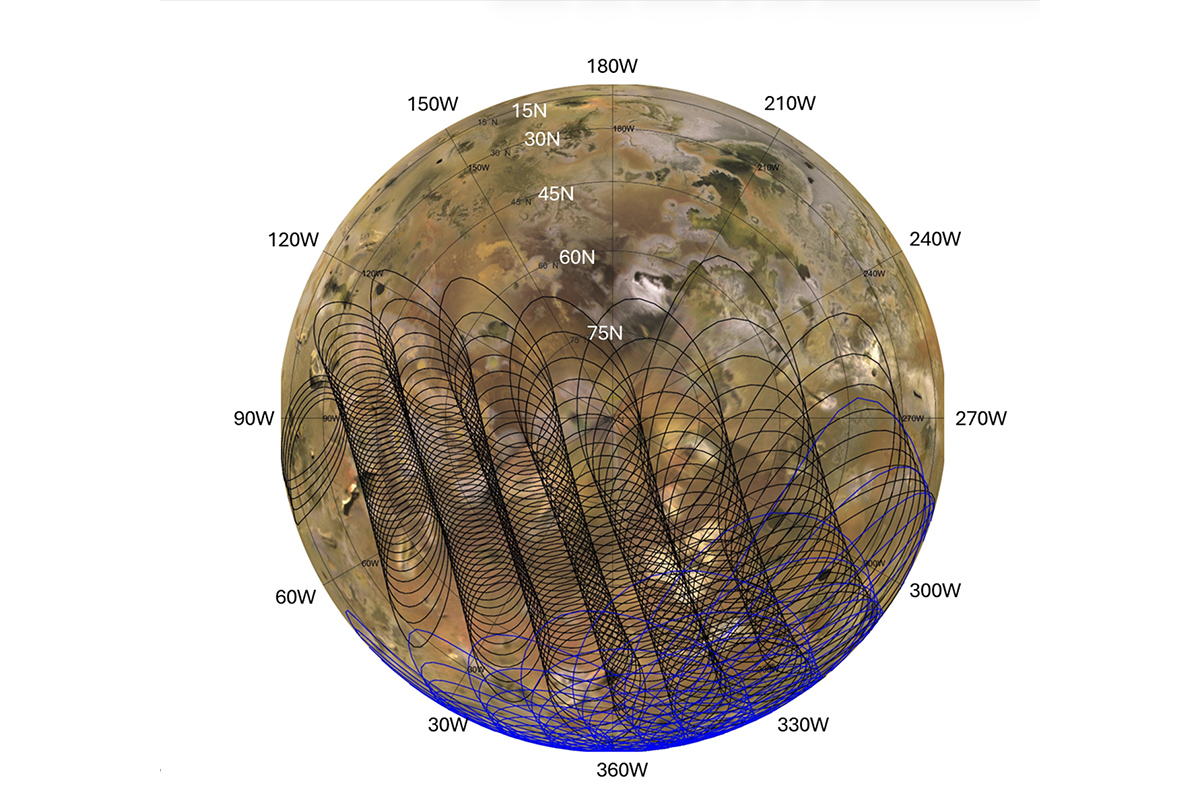
Home This graphic illustrates the areas of Io sampled by the Microwave Radiometer instrument aboard NASA’s Juno spacecraft during two close flybys of the Jovian moon. (NASA/JPL-Caltech/SwRI/USGS) This graphic illustrates the areas of Io sampled by the Microwave Radiometer instrument aboard NASA’s Juno spacecraft during two close flybys of the Jovian moon. (NASA/JPL-Caltech/SwRI/USGS)
This graphic illustrates the areas of Io sampled by the Microwave Radiometer instrument aboard NASA’s Juno spacecraft during two close flybys of the Jovian moon. (NASA/JPL-Caltech/SwRI/USGS)