Market Commentary by Scott J. Brown, Ph.D., Chief Economist

- Scott J. Brown Ph.D., Chief Economist Raymond James Investment Services
The economic data were mixed. Retail sales and industrial production figures for January disappointed, but softness was seen as likely to have been the result of poor weather. The Fed’s two main regional manufacturing surveys were strong in February, with a further intensification of input price pressures and evidence that firms are a bit more able to pass along higher costs. January inflation figures were mostly higher than expected. The core CPI rose 0.2%, reflecting some one-time increases (such as apparel). Minutes of the January 25-26 Fed policy meeting showed that officials were somewhat more optimistic about 2011 GDP growth, but did not expect much improvement in the unemployment rate over the course of the year.
The stock market seemed to struggle a bit with the economic data, although reactions were limited. The major market averages still managed to forge ahead during the week.
Next week, the economic data will be subject to more than the usual uncertainties. Home sales are normally low in January – seasonal adjustment may magnify any adverse effects from poor weather. The Conference Board changed the company that does the actual sampling for the Consumer Confidence Index, so new figures may not be exactly comparable to the old (although they’re supposed to be). Durable goods orders are notoriously choppy – expect a rebound in aircraft orders and some weather effects in January. The government’s estimate of fourth quarter GDP growth is likely to be revised higher. Looking ahead, the February Employment Report looms large, but there will likely be some lingering weather effects in the jobs data.
Indices
| Last | Last Week | YTD return % | |
| DJIA | 12318.14 | 12229.3 | 6.40% |
| NASDAQ | 2831.58 | 2790.45 | 6.74% |
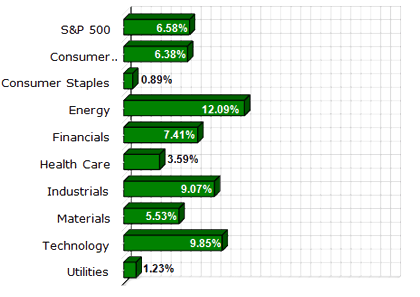
| S&P 500 | 1340.43 | 1321.87 | 6.58% |
| MSCI EAFE | 1753.83 | 1725.59 | 5.76% |
| Russell 2000 | 834.02 | 812.7 | 6.43% |
Consumer Money Rates
| Last | 1-year ago | |
| Prime Rate | 3.25 | 3.25 |
| Fed Funds | 0.16 | 0.13 |
| 30-year mortgage | 4.93 | 5.13 |
Currencies
| Last | 1-year ago | |
| Dollars per British Pound | 1.616 | 1.570 |
| Dollars per Euro | 1.359 | 1.362 |
| Japanese Yen per Dollar | 83.290 | 90.800 |
| Canadian Dollars per Dollar | 0.985 | 1.046 |
| Mexican Peso per Dollar | 12.038 | 12.877 |
Commodities
| Last | 1-year ago | |
| Crude Oil | 86.36 | 77.33 |
| Gold | 1383.43 | 1119.25 |
Bond Rates
| Last | 1-month ago | |
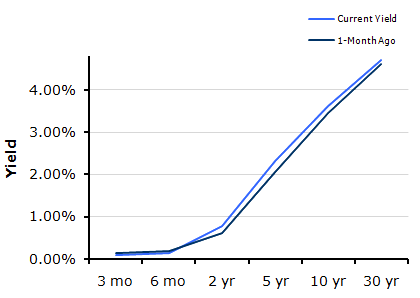
| 2-year treasury | 0.79 | 0.62 |
| 10-year treasury | 3.62 | 3.45 |
| 10-year municipal (TEY) | 5.57 | 5.54 |
Treasury Yield Curve – 2/18/2011

S&P Sector Performance (YTD) – 2/18/2011

Economic Calendar
| February 21st | — | Presidents’ Day (markets closed) |
| February 22nd | — | S&P/Case-Shiller Home Prices (December) Consumer Confidence (February) |
| February 23rd | — | Existing Home Sales (January) |
| February 24th | — | Jobless Claims (week ending February 19th) Durable Goods Orders (January) New Home Sales (January) |
| February 25th | — | Real GDP (Q410, 2nd estimate) Consumer Sentiment (February) |
| February 28th | — | Personal Income and Spending (January) |
| March 1st | — | ISM Manufacturing Index |
| March 2nd | — | Bernanke Monetary Policy Testimony (tentative) |
| March 3rd | — | ISM Non-Manufacturing Index (February) |
| March 4th | — | Employment Report (February) |
| March 15th | — | FOMC Meeting |
Important Disclosures
Past performance is not a guarantee of future results. There are special risks involved with global investing related to market and currency fluctuations, economic and political instability, and different financial accounting standards. The above material has been obtained from sources considered reliable, but we do not guarantee that it is accurate or complete. There is no assurance that any trends mentioned will continue in the future. While interest on municipal bonds is generally exempt from federal income tax, it may be subject to the federal alternative minimum tax, state or local taxes. In addition, certain municipal bonds (such as Build America Bonds) are issued without a federal tax exemption, which subjects the related interest income to federal income tax. Investing involves risk and investors may incur a profit or a loss.
US government bonds and treasury bills are guaranteed by the US government and, if held to maturity, offer a fixed rate of return and guaranteed principal value. US government bonds are issued and guaranteed as to the timely payment of principal and interest by the federal government. Treasury bills are certificates reflecting short-term (less than one year) obligations of the US government.
Commodities trading is generally considered speculative because of the significant potential for investment loss. Markets for commodities are likely to be volatile and there may be sharp price fluctuations even during periods when prices overall are rising. Specific sector investing can be subject to different and greater risks than more diversified investments.
Tax Equiv Muni yields (TEY) assume a 35% tax rate on triple-A rated, tax-exempt insured revenue bonds.
![]() Material prepared by Raymond James for use by its financial advisors.
Material prepared by Raymond James for use by its financial advisors.
The information contained herein has been obtained from sources considered reliable, but we do not guarantee that the foregoing material is accurate or complete. Data source: Bloomberg, as of close of business February 10th, 2011.
©2011 Raymond James Financial Services, Inc. member FINRA / SIPC.


