 Clarksville, TN – As was widely anticipated, Republicans picked up enough seats in the mid-term elections to control the Senate. Voter turnout was low, especially among young people and Hispanics.
Some are hopeful for a new spirit of bipartisanship, which happens after every mid-term election. Others are expecting the Republicans to accomplish things, such as tax reform and immigration reform.

Expect another two years of gridlock and an even more divisive and expensive election season in 2016.
Despite a heavy week of economic data, the figures seemed to have had little influence on the financial markets. Stock market participants were encouraged by the election results and by a hint of possible further action from the European Central Bank (similar to the U.S. market reaction that followed the Bank of Japan’s surprise move on October 31).
The October Employment Report was not as strong as anticipated, but it was still a strong report. Nonfarm payrolls rose by 214,000 (vs. a median forecast of +230,000 and whispers of a higher figure), while August and September were revised a net 31,000 higher. The economy added 1.064 million jobs prior to seasonal adjustment, vs. +944,000 in October 2013.
The unemployment rate fell to 5.8%, with declines concentrated in teenagers and young adults (suggesting that there may have been some issues with the seasonal adjustment). The employment/population ratio rose to 59.2% (vs. 59.0% in September and 58.2% a year ago), consistent with the view that labor market slack is being taken up gradually.
Next week, the economic calendar thins out considerably. Following weak results in September, the October retail sales figures should receive more scrutiny than usual. Lower gasoline prices are likely to restrain the headline figures for October, but are adding to consumer purchasing power in the near term.
Indices
| Last | Last Week | YTD return % | |
| DJIA | 17554.47 | 17195.42 | 5.90% |
| NASDAQ | 4638.47 | 4566.14 | 11.06% |
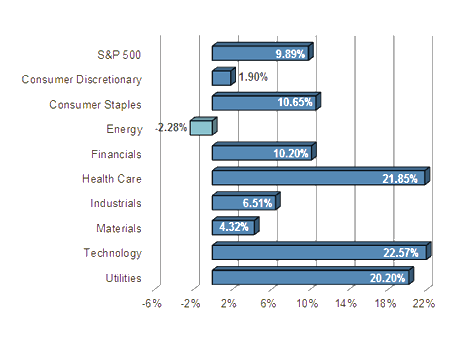
| S&P 500 | 2031.21 | 1994.65 | 9.89% |
| MSCI EAFE | 1804.10 | 1798.61 | -5.82% |
| Russell 2000 | 1171.86 | 1155.77 | 0.71% |
Consumer Money Rates
| Last | 1 year ago | |
| Prime Rate | 3.25 | 3.25 |
| Fed Funds | 0.09 | 0.08 |
| 30-year mortgage | 4.06 | 4.16 |
Currencies
| Last | 1 year ago | |
| Dollars per British Pound | 1.595 | 1.610 |
| Dollars per Euro | 1.251 | 1.351 |
| Japanese Yen per Dollar | 114.600 | 98.610 |
| Canadian Dollars per Dollar | 1.140 | 1.044 |
| Mexican Peso per Dollar | 13.577 | 13.118 |
Commodities
| Last | 1 year ago | |
| Crude Oil | 77.91 | 94.80 |
| Gold | 1144.85 | 1318.71 |
Bond Rates
| Last | 1 month ago | |
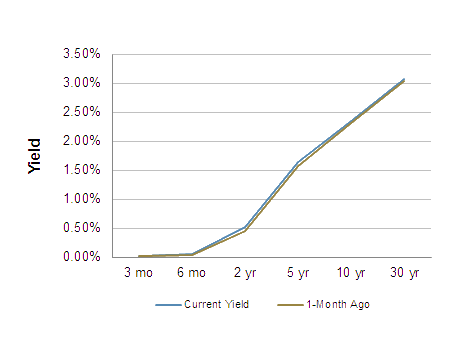
| 2-year treasury | 0.51 | 0.45 |
| 10-year treasury | 2.35 | 2.31 |
| 10-year municipal (TEY) | 3.39 | 3.32 |
Treasury Yield Curve – 11/7/2014
S&P Sector Performance (YTD) – 11/7/2014
Economic Calendar
| November 11th | — | Veterans Day (bond market closed) |
| November 12th | — | Small Business Optimism Index (October) |
| November 13th | — | Jobless Claims (week ending November 8th) |
| November 14th | — | Retail Sales (October) Import Prices (October) |
| November 17th | — | Industrial Production (October) |
| November 19th | — | Building Permits, Housing Starts (October) FOMC Minutes (October 28th-29th) |
| November 25th | — | Real GDP (3Q14, 2nd estimate) |
Important Disclosures
US government bonds and treasury bills are guaranteed by the US government and, if held to maturity, offer a fixed rate of return and guaranteed principal value. US government bonds are issued and guaranteed as to the timely payment of principal and interest by the federal government. Treasury bills are certificates reflecting short-term (less than one year) obligations of the US government.
Commodities trading is generally considered speculative because of the significant potential for investment loss. Markets for commodities are likely to be volatile and there may be sharp price fluctuations even during periods when prices overall are rising. Specific sector investing can be subject to different and greater risks than more diversified investments.
Tax Equiv Muni yields (TEY) assume a 35% tax rate on triple-A rated, tax-exempt insured revenue bonds.
![]() Material prepared by Raymond James for use by its financial advisors.
Material prepared by Raymond James for use by its financial advisors.
The information contained herein has been obtained from sources considered reliable, but we do not guarantee that the foregoing material is accurate or complete. Data source: Bloomberg, as of close of business October 30th, 2014.
©2014 Raymond James Financial Services, Inc. member FINRA / SIPC.


