 Clarksville, TN – The economic data calendar was relatively thin, leaving stock market investors to fret about a likely December rate hike from the Fed. A 25-basis-point increase in short-term interest rates should not have much of an impact on the economy, especially if the Fed follows up very gradually (as anticipated).
However, the financial markets see the initial tightening move as a big deal, so it is. Weak earnings results haven’t helped, but most of the weakness is tied to the strong dollar and slower growth abroad.

However, the trend isn’t horrible (slower, but still positive). The Producer Price data surprised to the downside, reflecting a further drop in food prices and a decline in the core index. Pipeline pressures (inflation figures for the earlier stages of production) remained negative.
Next week, the data on industrial production and residential construction will help fill in the economic picture, but investors are more likely to focus on the FOMC minutes. Those minutes should show Fed officials leaning toward a December rate hike.
We should get some color on why officials are set to hike (expectations of less slack a year from now) and what it would take for the Fed to delay (bad economic data or significant financial market disruptions).
Indices
| Last | Last Week | YTD return % | |
| DJIA | 17448.07 | 17863.43 | -2.10% |
| NASDAQ | 5005.08 | 5127.74 | 5.68% |
| S&P 500 | 2045.97 | 2099.93 | -0.63% |
| MSCI EAFE | 1728.63 | 1758.31 | -2.61% |
| Russell 2000 | 1154.81 | 1190.69 | -4.14% |
Consumer Money Rates
| Last | 1 year ago | |
| Prime Rate | 3.25 | 3.25 |
| Fed Funds | 0.13 | 0.08 |
| 30-year mortgage | 4.04 | 4.01 |
Currencies
| Last | 1 year ago | |
| Dollars per British Pound | 1.519 | 1.588 |
| Dollars per Euro | 1.073 | 1.247 |
| Japanese Yen per Dollar | 122.980 | 115.260 |
| Canadian Dollars per Dollar | 1.327 | 1.132 |
| Mexican Peso per Dollar | 16.730 | 13.584 |
Commodities
| Last | 1 year ago | |
| Crude Oil | 41.75 | 77.18 |
| Gold | 1087.75 | 1163.50 |
Bond Rates
| Last | 1 month ago | |
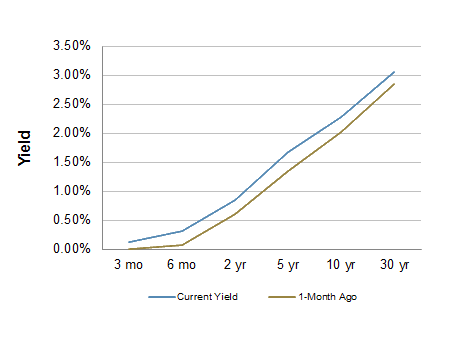
| 2-year treasury | 0.85 | 0.60 |
| 10-year treasury | 2.28 | 2.02 |
| 10-year municipal (TEY) | 3.38 | 3.21 |
Treasury Yield Curve – 11/13/2015
As of close of business 11/12/2015
Economic Calendar
| Nov 16th | — | Empire State Manufacturing Index (November) |
| Nov 17th | — | Consumer Price Index (October) Industrial Production (October) Homebuilder Sentiment (October) |
| Nov 18th | — | Building Materials, Housing Starts (October) FOMC Minutes (October 27th-28th) |
| Nov 19th | — | Jobless Claims (week ending November 14th) Philadelphia Fed Index (November) Leading Economic Indicators (October) |
| Nov 23rd | — | Existing Home Sales (October) |
| Nov 24th | — | Real GDP (2Q15, 2nd estimate) Trade Balance in Goods (October) Consumer Confidence (November) |
Important Disclosures
Past performance is not a guarantee of future results. There are special risks involved with global investing related to market and currency fluctuations, economic and political instability, and different financial accounting standards. The above material has been obtained from sources considered reliable, but we do not guarantee that it is accurate or complete. There is no assurance that any trends mentioned will continue in the future. While interest on municipal bonds is generally exempt from federal income tax, it may be subject to the federal alternative minimum tax, state or local taxes. In addition, certain municipal bonds (such as Build America Bonds) are issued without a federal tax exemption, which subjects the related interest income to federal income tax. Investing involves risk and investors may incur a profit or a loss.US government bonds and treasury bills are guaranteed by the US government and, if held to maturity, offer a fixed rate of return and guaranteed principal value. US government bonds are issued and guaranteed as to the timely payment of principal and interest by the federal government. Treasury bills are certificates reflecting short-term (less than one year) obligations of the US government.
Commodities trading is generally considered speculative because of the significant potential for investment loss. Markets for commodities are likely to be volatile and there may be sharp price fluctuations even during periods when prices overall are rising. Specific sector investing can be subject to different and greater risks than more diversified investments.
Tax Equiv Muni yields (TEY) assume a 35% tax rate on triple-A rated, tax-exempt insured revenue bonds.
![]() Material prepared by Raymond James for use by its financial advisors.
Material prepared by Raymond James for use by its financial advisors.
The information contained herein has been obtained from sources considered reliable, but we do not guarantee that the foregoing material is accurate or complete. Data source: Bloomberg, as of close of business November 12th, 2015.


