Market Commentary by Scott J. Brown, Ph.D., Chief Economist

Acting after Standard and Poor’s decision to downgrade U.S. debt and a subsequent 635-point drop in the Dow Industrials on Monday, August 8th, the Federal Reserve announced on Tuesday the 9th that it was freezing short-term interest rates for at least two years. The Fed also said it was discussing a “range of policy tools” that it was “prepared to employ,” which some investors interpreted as meaning additional monetary stimulus might be forthcoming if the economy remains weak.
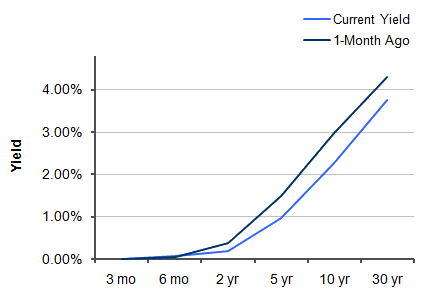
Yields on short-term Treasury debt fell after the Fed announcement, with two-year notes offering just 17 basis points and yields on the benchmark 10-year Treasury notes dropping to levels last seen during the 2008 financial crisis. Noting that economic growth this year has been “considerably slower” than it had expected, the Fed also said it expects “a somewhat slower pace of recovery over coming quarters”.
Markets have been extraordinarily volatile, with stocks swinging more than 4% in alternate directions during the first four days of the week. After plummeting 6.7% on Monday, August 8, the S&P 500 jumped 4.7% on the 9th, dropped 4.4% on the 10th and soared 4.6% on the 11th. The struggle between those who fear renewed recession and widening European debt problems versus those focused on robust corporate profits left the S&P down about 2% going into Friday’s session. Stocks were then hit by news of a sharp drop in consumer confidence, with the consumer sentiment index from Reuters/University of Michigan sliding to 54.9 in mid-August from 63.7 in late July. On the plus side, retail sales rose in July, giving ammunition to those who believe that consumer spending, a major economic driver, is holding up.
Next week, the mid-month economic data could generate some reactions in the financial markets, but aren’t expected to add much to the overall economic picture. Residential construction figures may have softened a bit further in July, reflecting the usual volatility in the multi-family sector (keep an eye on single-family permits, which are the most important). Industrial production should get a boost from the hot weather in July (increased output from utilities), with a moderate July gain (but a lackluster trend). Retail gasoline prices edged up in July and the seasonal adjustment expects a relatively large decline – hence, seasonally-adjusted gasoline prices are expected to increase significantly, adding to the headline CPI figure. Ex-food & energy, the CPI is likely to post a more modest gain, reflecting a rollback in apparel prices (which uncharacteristically jumped in both May and June).
Indices
| Last | Last Week | YTD return % | |
| DJIA | 11143.31 | 11383.68 | -3.75% |
| NASDAQ | 2492.68 | 2556.39 | -6.04% |
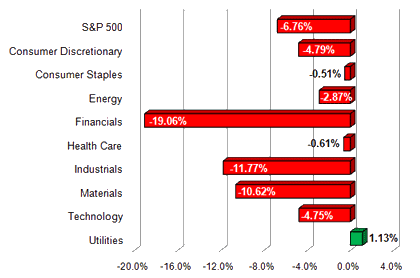
| S&P 500 | 1172.64 | 1200.07 | -6.76% |
| MSCI EAFE | 1466.85 | 1547.43 | -11.54% |
| Russell 2000 | 726.80 | 695.89 | -11.20% |
Consumer Money Rates
| Last | 1-year ago | |
| Prime Rate | 3.25 | 3.25 |
| Fed Funds | 0.14 | 0.20 |
| 30-year mortgage | 4.22 | 4.51 |
Currencies
| Last | 1-year ago | |
| Dollars per British Pound | 1.622 | 1.566 |
| Dollars per Euro | 1.421 | 1.288 |
| Japanese Yen per Dollar | 76.720 | 85.290 |
| Canadian Dollars per Dollar | 0.988 | 1.046 |
| Mexican Peso per Dollar | 12.363 | 12.749 |
Commodities
| Last | 1-year ago | |
| Crude Oil | 85.72 | 78.02 |
| Gold | 1764.75 | 1196.80 |
Bond Rates
| Last | 1-month ago | |
| 2-year treasury | 0.19 | 0.37 |
| 10-year treasury | 2.27 | 2.98 |
| 10-year municipal (TEY) | 3.54 | 4.06 |
Treasury Yield Curve – 8/12/2011

S&P Sector Performance (YTD) – 8/12/2011

Economic Calendar
| August 15th |
— |
Empire St. Manf. Index (August) Homebuilder Sentiment (August) |
| August 16th |
— |
Import Prices (July) Building Permits, Housing Starts (July) Industrial Production (July) |
| August 17th |
— |
Producer Price Index (July) |
| August 18th |
— |
Jobless Claims (week ending August 13th) Consumer Price Index (July) Real Weekly Earnings (July) Existing Home Sales (July) Philadelphia Fed Index (August) Leading Economic Indicators (July) |
| August 30th |
— |
Consumer Confidence (August) |
| September 1st |
— |
ISM Manufacturing Index |
| September 2d |
— |
Employment Report (August) |
| September 5th |
— |
Labor Day (markets closed) |
Important Disclosures
Past performance is not a guarantee of future results. There are special risks involved with global investing related to market and currency fluctuations, economic and political instability, and different financial accounting standards. The above material has been obtained from sources considered reliable, but we do not guarantee that it is accurate or complete. There is no assurance that any trends mentioned will continue in the future. While interest on municipal bonds is generally exempt from federal income tax, it may be subject to the federal alternative minimum tax, state or local taxes. In addition, certain municipal bonds (such as Build America Bonds) are issued without a federal tax exemption, which subjects the related interest income to federal income tax. Investing involves risk and investors may incur a profit or a loss.
US government bonds and treasury bills are guaranteed by the US government and, if held to maturity, offer a fixed rate of return and guaranteed principal value. US government bonds are issued and guaranteed as to the timely payment of principal and interest by the federal government. Treasury bills are certificates reflecting short-term (less than one year) obligations of the US government.
Commodities trading is generally considered speculative because of the significant potential for investment loss. Markets for commodities are likely to be volatile and there may be sharp price fluctuations even during periods when prices overall are rising. Specific sector investing can be subject to different and greater risks than more diversified investments.
Tax Equiv Muni yields (TEY) assume a 35% tax rate on triple-A rated, tax-exempt insured revenue bonds.
![]() Material prepared by Raymond James for use by its financial advisors.
Material prepared by Raymond James for use by its financial advisors.
The information contained herein has been obtained from sources considered reliable, but we do not guarantee that the foregoing material is accurate or complete. Data source: Bloomberg, as of close of business August 11th, 2011.
©2011 Raymond James Financial Services, Inc. member FINRA / SIPC.


