Market Commentary by Scott J. Brown, Ph.D., Chief Economist
 The economic data were mixed, but generally consistent with moderate growth in the near term. Retail sales and industrial production were largely in line with expectations. Jobless claims sank and housing starts jumped, boosting the major stock market indices, although seasonal adjustment likely played a part. The Fed’s two major regional surveys disappointed, reflecting contractions in new orders and employment and some pickup in input price pressures.
Earnings reports were mixed, but investors seemed more concerned with the path ahead.
There will be three major hurdles in Washington over the next few weeks. 1) The drop dead date for the debt ceiling is expected between February 15th and March 1st. 2) Large spending cuts are set to begin on March 1st (but the sequester could be delayed again). 3) The Continuing Resolution that authorizes government spending expires on March 27th (most likely, we’ll simply see another CR, but there may be some noise and uncertainty).Next week, the economic data calendar is relatively light. Home sales figures could be exaggerated by the seasonal adjustment. Annual benchmark revisions will be incorporated into the Index of Leading Economic Indicators, but the recent story is not expected to change much (and the drop jobless claims will make a significant positive contribution in the December calculation). Earnings should remain a factor for equities.
Indices
| Last | Last Week | YTD return % | |
| DJIA | 13596.02 | 13471.22 | 3.75% |
| NASDAQ | 3136.00 | 3121.76 | 3.86% |
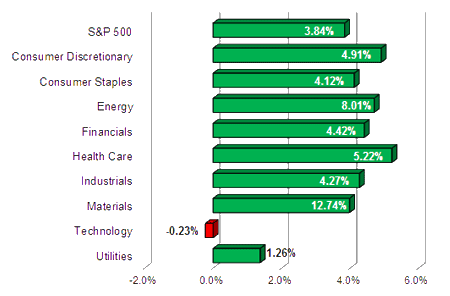
| S&P 500 | 1480.94 | 1472.12 | 3.84% |
| MSCI EAFE | 1655.22 | 1647.16 | 3.19% |
| Russell 2000 | 890.36 | 881.24 | 4.83% |
Consumer Money Rates
| Last | 1-year ago | |
| Prime Rate | 3.25 | 3.25 |
| Fed Funds | 0.16 | 0.08 |
| 30-year mortgage | 3.47 | 3.92 |
Currencies
| Last | 1-year ago | |
| Dollars per British Pound | 1.599 | 1.535 |
| Dollars per Euro | 1.336 | 1.273 |
| Japanese Yen per Dollar | 89.710 | 76.840 |
| Canadian Dollars per Dollar | 0.985 | 1.014 |
| Mexican Peso per Dollar | 12.567 | 13.459 |
Commodities
| Last | 1-year ago | |
| Crude Oil | 95.49 | 100.71 |
| Gold | 1694.45 | 1656.45 |
Bond Rates
| Last | 1-month ago | |
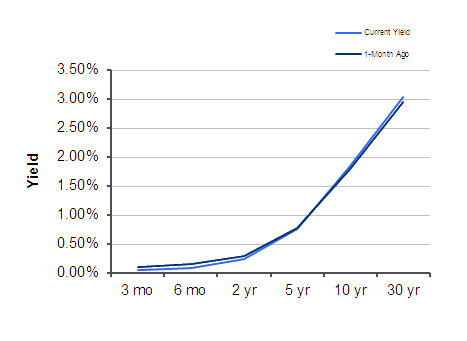
| 2-year treasury | 0.25 | 0.30 |
| 10-year treasury | 1.84 | 1.79 |
| 10-year municipal (TEY) | 2.57 | 2.66 |
Treasury Yield Curve – 01/18/2013
S&P Sector Performance (YTD) – 01/18/2013
Economic Calendar
| January 21dt |
— |
MLK, Jr. Holiday (markets closed) |
| January 22nd |
— |
Existing Home Sales (December) |
| January 24th |
— |
Jobless Claims (week ending January 19th) Leading Economic Indicators (December) |
| January 25th |
— |
New Home Sales (December) |
| January 28th |
— |
Durable Goods Orders (December) |
| January 29th |
— |
Consumer Confidence (January) |
| January 30th |
— |
Real GDP (1Q13, advance estimate) FOMC Policy Decision (no Bernanke press briefing) |
| February 1st |
— |
Employment Report (January) |
| February 3rd |
— |
Super Bowl XLVII |
| February 18th |
— |
Presidents Day Holiday (markets closed) |
| March 20th |
— |
FOMC Policy Decision, Bernanke Press Briefing |
Important Disclosures
US government bonds and treasury bills are guaranteed by the US government and, if held to maturity, offer a fixed rate of return and guaranteed principal value. US government bonds are issued and guaranteed as to the timely payment of principal and interest by the federal government. Treasury bills are certificates reflecting short-term (less than one year) obligations of the US government.
Commodities trading is generally considered speculative because of the significant potential for investment loss. Markets for commodities are likely to be volatile and there may be sharp price fluctuations even during periods when prices overall are rising. Specific sector investing can be subject to different and greater risks than more diversified investments.
Tax Equiv Muni yields (TEY) assume a 35% tax rate on triple-A rated, tax-exempt insured revenue bonds.
![]() Material prepared by Raymond James for use by its financial advisors.
Material prepared by Raymond James for use by its financial advisors.
The information contained herein has been obtained from sources considered reliable, but we do not guarantee that the foregoing material is accurate or complete. Data source: Bloomberg, as of close of business January 17th, 2013.
©2013 Raymond James Financial Services, Inc. member FINRA / SIPC.


