 Clarksville, TN – Developments in Iraq sent oil prices higher and undermined stock market sentiment. Note that oil price shocks are viewed as a restrain on economic growth rather than a catalyst for a higher underlying trend in inflation (as opposed to the 1970s, when they quickly fed through to wage inflation).
Iraq is one more concern to be added to the list of worries for the second half of the year. The stock market often climbs “a wall of worry,” but sometimes the wall wins.

The Producer Price Index fell unexpected in May, while pipeline inflation pressures appeared to be generally benign.
Next week the focus will be on the Fed policy decision. The Federal Open Market Committee is widely expected to further taper the monthly pace of asset purchases by another $10 billion (to $35 billion, starting in July).
The forward guidance (on short-term interest rates) is expected to remain unchanged – monetary policy in 2015 will depend on the evolution of the economic outlook and financial conditions in the second half of 2014. The five Fed governors and 12 district bank presidents will submit revised forecasts of growth, unemployment, and inflation.
They will also project the level of the federal funds target rate at the end of the next few years, but investors should not worry much about “the movement of the dots.” Fed Chair Janet Yellen is expected to play it close to the vest in her press conference.
Indices
| Last | Last Week | YTD return % | |
| DJIA | 16734.19 | 16836.11 | 0.95% |
| NASDAQ | 4297.63 | 4296.23 | 2.90% |
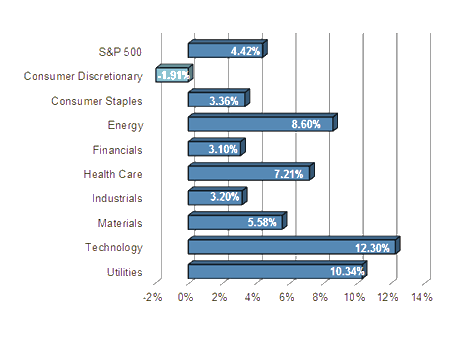
| S&P 500 | 1930.11 | 1940.46 | 4.42% |
| MSCI EAFE | 1971.83 | 1961.57 | 2.94% |
| Russell 2000 | 1159.40 | 1153.94 | -0.36% |
Consumer Money Rates
| Last | 1-year ago | |
| Prime Rate | 3.25 | 3.25 |
| Fed Funds | 0.09 | 0.09 |
| 30-year mortgage | 4.20 | 3.98 |
Currencies
| Last | 1-year ago | |
| Dollars per British Pound | 1.683 | 1.566 |
| Dollars per Euro | 1.352 | 1.328 |
| Japanese Yen per Dollar | 102.070 | 96.680 |
| Canadian Dollars per Dollar | 1.086 | 1.018 |
| Mexican Peso per Dollar | 13.011 | 12.742 |
Commodities
| Last | 1-year ago | |
| Crude Oil | 106.53 | 95.88 |
| Gold | 1265.29 | 1377.14 |
Bond Rates
| Last | 1-month ago | |
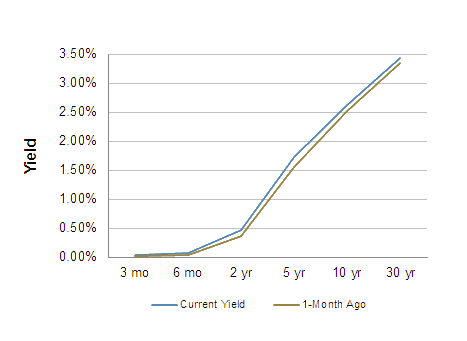
| 2-year treasury | 0.46 | 0.36 |
| 10-year treasury | 2.62 | 2.51 |
| 10-year municipal (TEY) | 3.72 | 3.77 |
Treasury Yield Curve – 6/13/2014
S&P Sector Performance (YTD) – 6/13/2014
Economic Calendar
| June 16th | — | Empire State Manufacturing Index (June) Industrial Production (May) Homebuilder Sentiment (June) |
| June 17th | — | Consumer Price Index (May) Building Permits, Housing Starts (May) |
| June 18th | — | Current Account (1Q14 + comprehensive revisions) FOMC Policy Decision, Yellen Press Conference |
| June 19th | — | Jobless Claims (week ending June 14th) Philly Fed Index (June) Leading Economic Indicators (May) |
| June 25th | — | Existing Home Sales (May) |
| June 26th | — | New Home Sales (May) Consumer Confidence (June) |
| June 27th | — | Real GDP (1Q14, 3rd estimate) Durable Goods Orders (May) |
| July 3rd | — | Employment Report (June) |
| July 4th | — | Independence Day Holiday (markets closed) |
| July 30th | — | FOMC Policy Decision, (no press conference) |
Important Disclosures
US government bonds and treasury bills are guaranteed by the US government and, if held to maturity, offer a fixed rate of return and guaranteed principal value. US government bonds are issued and guaranteed as to the timely payment of principal and interest by the federal government. Treasury bills are certificates reflecting short-term (less than one year) obligations of the US government.
Commodities trading is generally considered speculative because of the significant potential for investment loss. Markets for commodities are likely to be volatile and there may be sharp price fluctuations even during periods when prices overall are rising. Specific sector investing can be subject to different and greater risks than more diversified investments.
Tax Equiv Muni yields (TEY) assume a 35% tax rate on triple-A rated, tax-exempt insured revenue bonds.
![]() Material prepared by Raymond James for use by its financial advisors.
Material prepared by Raymond James for use by its financial advisors.
The information contained herein has been obtained from sources considered reliable, but we do not guarantee that the foregoing material is accurate or complete. Data source: Bloomberg, as of close of business June 12th, 2014.
©2014 Raymond James Financial Services, Inc. member FINRA / SIPC.


