 Clarksville, TN – The economic data were mixed, but the February Employment Report was stronger than expected. Nonfarm payrolls rose by 295,000 (±105,000), with a revision to January of -18,000. The BLS indicated that the payroll survey missed most of the bad weather that hit last month.
The household survey showed that 328,000 could not make it to work due to bad weather, which is about average (it was 601,000 in February 2014). Average weekly hours held steady (no weather impact).

The unemployment rate fell to 5.5% (vs. 5.7%), due partly to a decrease in labor force participation. The employment/population ratio held steady at 59.3% (vs. 58.8% a year ago).
Market participants viewed the jobs report as likely to pull forward the date of the Fed’s liftoff on short-term interest rates (June, rather than September). Stocks stumbled, bond yields rose, and the dollar strengthened further.
Next week, the economic calendar thins out. The focus is expected to be on Thursday’s retail sales figures. However, February is a transition month for most retailers, falling between the January clearance sales and Easter shopping.
Gasoline prices rebounded last month (still down substantially in recent months), which will add to the retail sales total. Investors are likely to look ahead to the upcoming Fed policy meeting.
Indices
| Last | Last Week | YTD return % | |
| DJIA | 18135.72 | 18214.42 | 1.75% |
| NASDAQ | 4982.81 | 4987.89 | 5.21% |
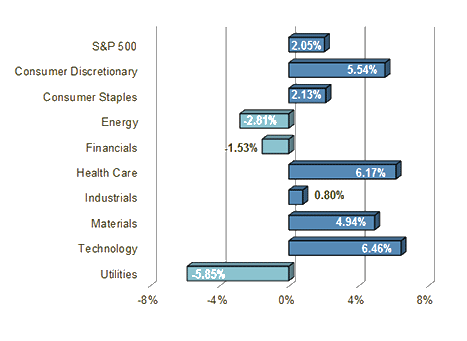
| S&P 500 | 2101.04 | 2110.74 | 2.05% |
| MSCI EAFE | 1865.56 | 1880.83 | 5.11% |
| Russell 2000 | 1234.31 | 1239.11 | 2.46% |
Consumer Money Rates
| Last | 1 year ago | |
| Prime Rate | 3.25 | 3.25 |
| Fed Funds | 0.12 | 0.07 |
| 30-year mortgage | 3.85 | 4.28 |
Currencies
| Last | 1 year ago | |
| Dollars per British Pound | 1.525 | 1.668 |
| Dollars per Euro | 1.105 | 1.372 |
| Japanese Yen per Dollar | 120.170 | 102.400 |
| Canadian Dollars per Dollar | 1.241 | 1.108 |
| Mexican Peso per Dollar | 15.064 | 13.267 |
Commodities
| Last | 1 year ago | |
| Crude Oil | 50.76 | 101.45 |
| Gold | 1200.56 | 1333.84 |
Bond Rates
| Last | 1 month ago | |
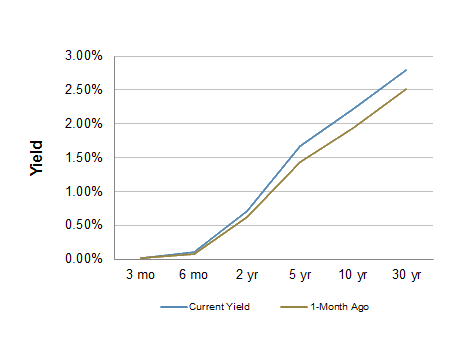
| 2-year treasury | 0.71 | 0.62 |
| 10-year treasury | 2.21 | 1.93 |
| 10-year municipal (TEY) | 3.32 | 2.80 |
Treasury Yield Curve – 03/06/2015
S&P Sector Performance (YTD) – 03/06/2015
Economic Calendar
| March 10th | — | Small Business Optimism Index (February) Job Opening and Labor Turnover Survey (January) |
| March 12th | — | Import Prices (February) Retail Sales (February) |
| March 13th | — | Producer Price Index (February) Consumer Sentiment (mid-March) |
| March 16th | — | Industrial Production (February) |
| March 17th | — | Building Permits, Housing Starts (February) |
| March 18th | — | FOMC Policy Decision, Yellen Press Conference |
Important Disclosures
Past performance is not a guarantee of future results. There are special risks involved with global investing related to market and currency fluctuations, economic and political instability, and different financial accounting standards. The above material has been obtained from sources considered reliable, but we do not guarantee that it is accurate or complete. There is no assurance that any trends mentioned will continue in the future. While interest on municipal bonds is generally exempt from federal income tax, it may be subject to the federal alternative minimum tax, state or local taxes. In addition, certain municipal bonds (such as Build America Bonds) are issued without a federal tax exemption, which subjects the related interest income to federal income tax. Investing involves risk and investors may incur a profit or a loss.US government bonds and treasury bills are guaranteed by the US government and, if held to maturity, offer a fixed rate of return and guaranteed principal value. US government bonds are issued and guaranteed as to the timely payment of principal and interest by the federal government. Treasury bills are certificates reflecting short-term (less than one year) obligations of the US government.
Commodities trading is generally considered speculative because of the significant potential for investment loss. Markets for commodities are likely to be volatile and there may be sharp price fluctuations even during periods when prices overall are rising. Specific sector investing can be subject to different and greater risks than more diversified investments.
Tax Equiv Muni yields (TEY) assume a 35% tax rate on triple-A rated, tax-exempt insured revenue bonds.
![]() Material prepared by Raymond James for use by its financial advisors.
Material prepared by Raymond James for use by its financial advisors.
The information contained herein has been obtained from sources considered reliable, but we do not guarantee that the foregoing material is accurate or complete. Data source: Bloomberg, as of close of business March 5th, 2015.


